Real Time

Passengers hate nothing more than the delays caused by waiting for a bus that never comes. 

Buses using Metric Tristarinc’s proprietary software solution are tracked in Real Time and every driver can see their adherence to the schedule on the driver console. At each fare stage they can tell if they are on time, running late, or if they are early and to take the appropriate corrective action immediately, limiting the number of missed deadlines and meeting customer expectations.

Features
  • Track and manage bus routes
  • Show progression of bus along a route
  • Allow for different payment methods
  • Generate a summary of the journey
  • Provide real-time passenger information
Examples of reports generated
  • Punctuality reports
  • GPS Route mapping
  • Real-Time journey information
  • Passenger load/Time per stop
  • Journey boards & dead runs trapping
Mobirise Website Builder
Track Your Fleet

Reports can be generated based on the GPS locations sent by the ETM while on-field, making use of the following events that occur during a trip.

1. GPS Positioning
2. Arrival at Stop
3. Departure from Stop
4. Stop Geo-fencing data
5. System updates

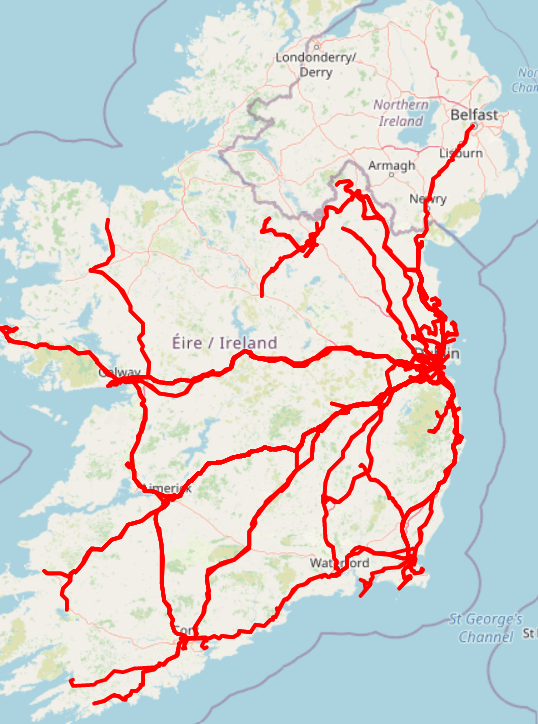
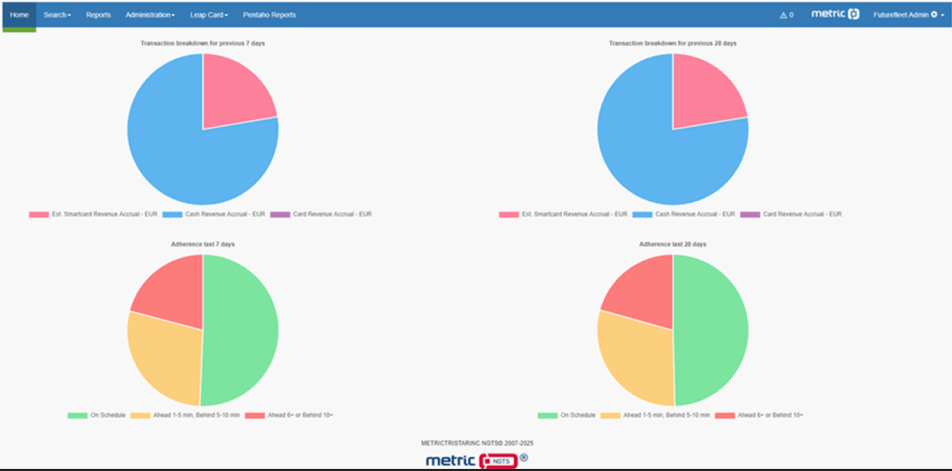
The time data noted during these events can be filtered and analyzed to represent a time graph and location map based on the data gathered during the communication update between the ETM and the back office. It is also possible to record and compare the adherence for the same journey over different time periods which provides an improved report for better time-table creation and decision making. 

Mobirise Website Builder
Real Time Maps

Our maps show the position of a bus in Real Time along with detailed information such as the scheduled departure and arrival times Vs actual departure and arrival times.

The Journey Information area below the map gives general information about the route; when the trip started and the last updated location. It also shows the last boarding stage and stop. 

Mobirise Website Builder
Adherence Stats & Transaction Breakdown

Adherence stats are displayed in easy to interpret pie chart format. The charts show the percentage of services that were either behind, ahead or on schedule and breaks these down into weekly and monthly summaries.

We can also show the breakdown of transactions by payment method also in weekly and monthly summaries. 

Follow us

AI Website Maker